Need Core Lab Dashboard Oversight?
Access note: The Core Lab Dashboard is only visible when the CoreLabDashboard extra role has been enabled for your account. The dashboard only shows trials, sites, patients, and visits that your user account is allowed to access.
Use the Core Lab Dashboard when you need a single worklist for visit status, QC progress, query activity, and turnaround metrics across the visits available to you.
Typical Users
- Quality Control Managers
- Project managers or monitors with Core Lab Dashboard access
- Oversight users who need cross-visit or cross-trial tracking
What Problem It Solves
The Core Lab Dashboard brings visit-level operational data into one table. It helps users see which visits are pending, which visits have open or closed queries, which QC steps are complete, and how long key workflow intervals are taking.
The dashboard can also show rows from more than one trial when your site user group has access to multiple trials. Administrative users manage that access in Management > User Group Management by editing the relevant site user group and assigning the required trials. Use the Trial column to see which trial each row belongs to.
How to Open It
Click Core Lab Dashboard from the top navigation bar.
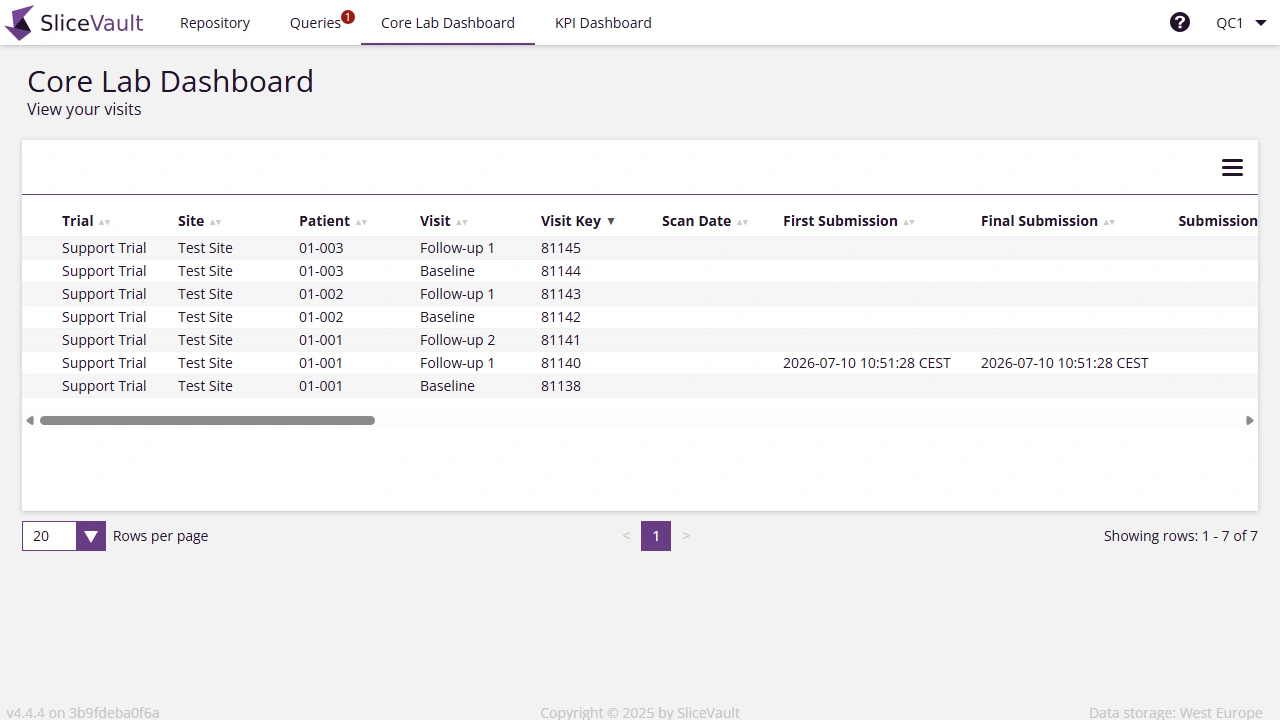
- Click Core Lab Dashboard in the top navigation.
- Review one row per accessible visit.
- Click a column header to sort the table.
- Use the horizontal scroll bar to view additional columns.
- Use the menu button in the upper-right corner of the table to open Settings.
Settings
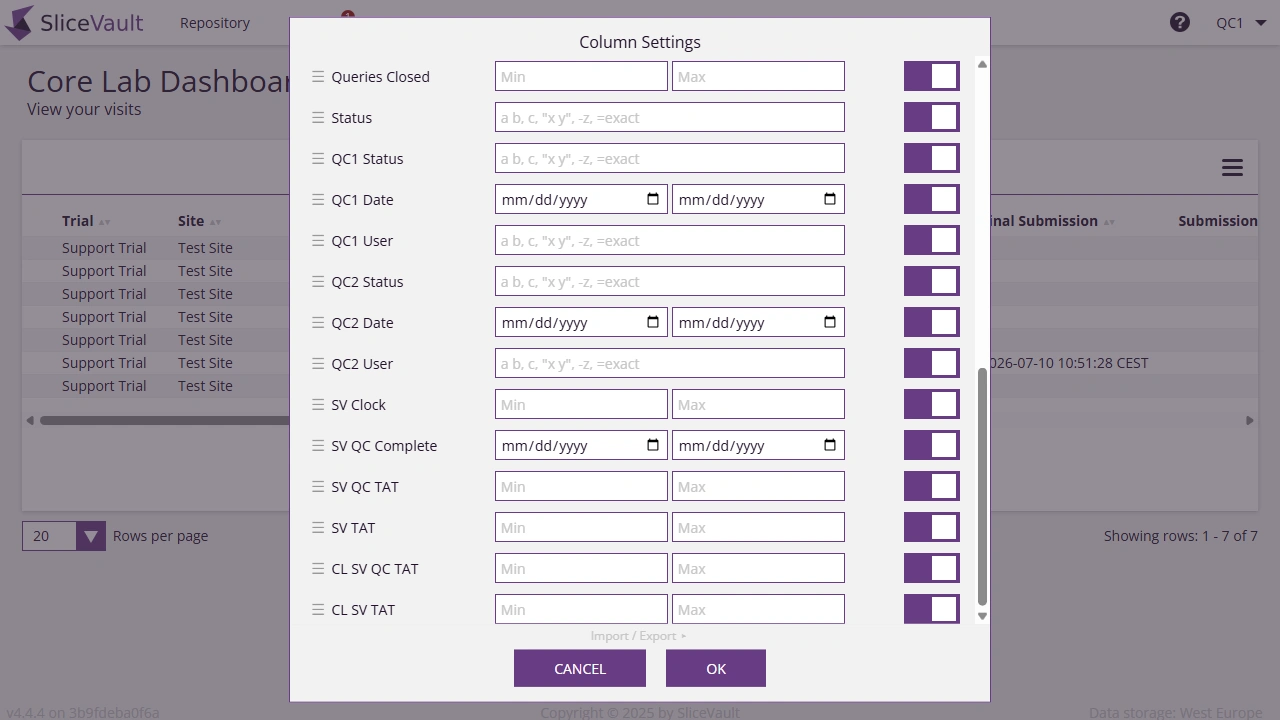
Open Settings from the menu button on the dashboard table.
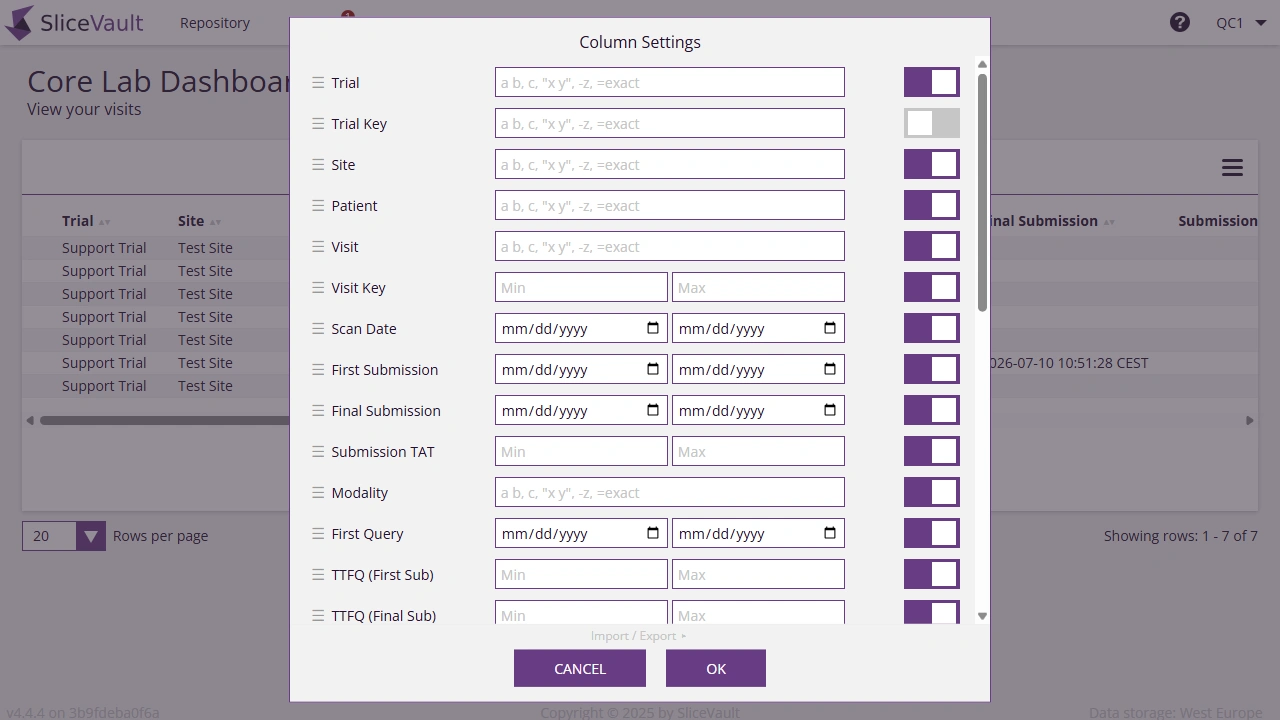
- Drag a column row to change the display order.
- Use the filter fields to limit the table by text, number, date, or duration.
- For text columns, enter a value such as
CTto match rows that contain that text, or start the value with=for an exact match such as=CTor="Submission pending". - Use the toggle for a column to show or hide it.
- Click OK to apply the current settings.
Every dashboard column is sortable from the table header and configurable in Core Lab Settings. The table below explains what each column means and how it can be filtered.
| Column | How the Value Is Defined | Filter in Core Lab Settings |
|---|---|---|
| Trial | The trial that the visit belongs to. This is especially important when the dashboard includes rows from multiple accessible trials. | Text |
| Trial Key | The trial identifier stored for the source visit row. This can be helpful when checking system references or comparing dashboard rows with administrative records. | Text |
| Site | The site display name assigned to the patient or visit. | Text |
| Patient | The configured patient identifier for the visit row. | Text |
| Visit | The configured visit or timepoint name. | Text |
| Visit Key | The numeric system identifier for the visit, matching the value shown in ImageSetManagement. | Number range |
| Scan Date | The visit scan date from the uploaded image data when available. | Date range |
| First Submission | The earliest investigator submission timestamp for the visit. It stays the same after rejection and resubmission and is blank before first submission. | Date range |
| Final Submission | The latest investigator submission timestamp for the visit. It updates after resubmission and is blank before first submission. | Date range |
| Submission TAT | The calculated duration from Scan Date to Final Submission when both values exist. | Duration range |
| Modality | The visit-level Modality value assigned during visit selection, such as PET or MR. This is not derived from DICOM tags. | Text |
| First Query | The timestamp of the first query raised for the visit. It is blank when no query exists. | Date range |
| TTFQ (First Sub) | Time To First Query (TTFQ), calculated from First Submission to First Query when both events exist. | Duration range |
| TTFQ (Final Sub) | Time To First Query (TTFQ), calculated from Final Submission to First Query when both events define a valid interval. | Duration range |
| In Query Duration | The accumulated duration that the visit has spent with a query open. It is blank when no query interval exists. | Duration range |
| Query Status | Open when at least one unresolved query exists for the visit, and Closed when no unresolved query remains. | Text |
| Queries Open | The count of unresolved query threads for the visit. | Number range |
| Queries Closed | The count of verified closed query threads for the visit. | Number range |
| Status | The current visit workflow status. | Text |
| QC1 Status | The current or completed QC1 workflow state for the visit. | Text |
| QC1 Date | The timestamp associated with the QC1 workflow state, including the approval timestamp when the visit is approved by QC1. It is blank before a QC1 workflow event exists. | Date range |
| QC1 User | The user associated with the QC1 workflow state or decision. | Text |
| QC2 Status | The current or completed QC2 workflow state for the visit. | Text |
| QC2 Date | The timestamp associated with the QC2 workflow state, including the approval timestamp when the visit is approved by QC2. It is blank before a QC2 workflow event exists. | Date range |
| QC2 User | The user associated with the QC2 workflow state or decision. | Text |
| SV Clock | The elapsed SliceVault processing duration for the visit when the required workflow interval exists. | Duration range |
| SV QC Complete | The timestamp when the SliceVault QC workflow is complete for the visit. It is blank before the completion event exists. | Date range |
| SV QC TAT | The calculated SliceVault QC turnaround duration when the required QC start and completion events exist. | Duration range |
| SV TAT | The calculated SliceVault overall turnaround duration when the required workflow events exist. | Duration range |
| CL SV QC TAT | The calculated Core Lab SliceVault QC turnaround duration when the required workflow events exist. | Duration range |
| CL SV TAT | The calculated Core Lab SliceVault overall turnaround duration when the required workflow events exist. | Duration range |
When a Value Looks Unexpected
Check the source workflow event behind the value. For example, confirm the investigator submission history for submission columns, the query history for query columns, and the QC1 or QC2 workflow actions for QC status, date, and user columns. For visit identity fields, check the visit configuration and ImageSetManagement for the selected trial.