Study Repository
The repository is the main oversight view for Monitors and Project Managers. It shows which patients and visits exist, where each visit is in the workflow, and where follow-up may still be needed.
Each row in the repository represents a patient, while each column corresponds to a study visit. Use this page to understand which visits exist, what status they are in, and which ones require follow-up.
Patient List
The patient list provides a complete overview of available data in SliceVault. Its columns are customized for each clinical trial and may differ from the example below.
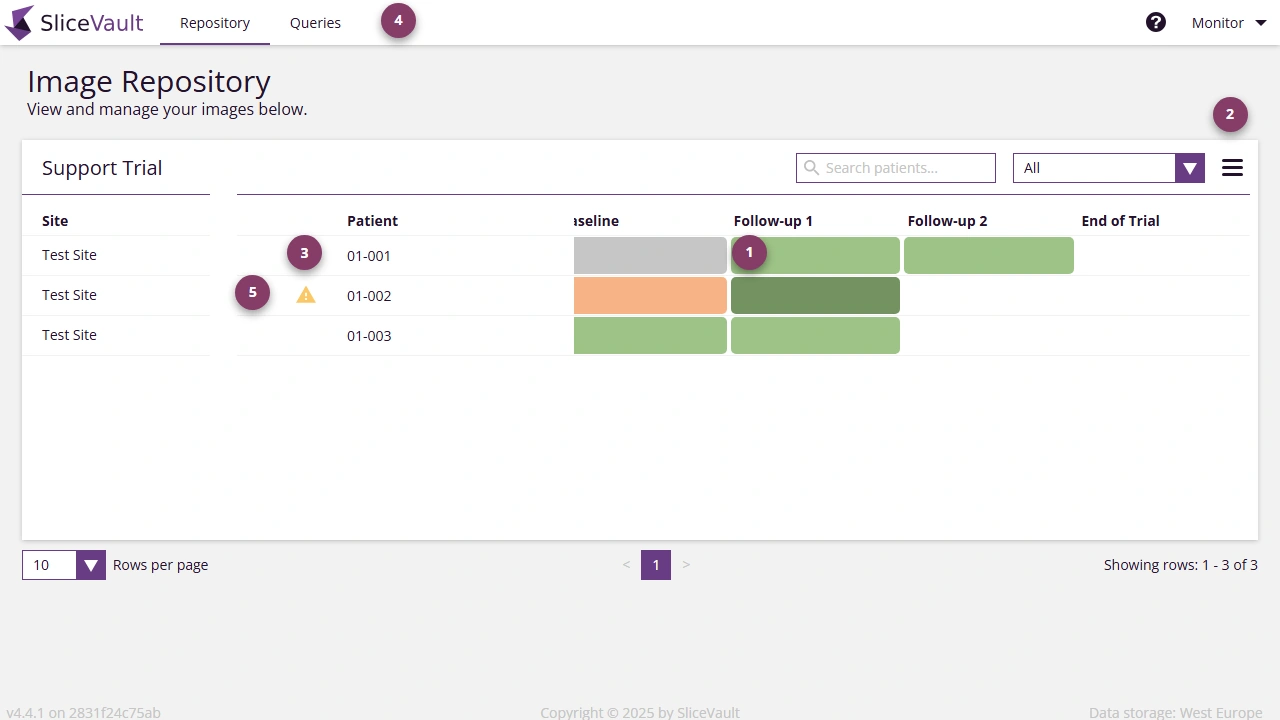
- Use 1 to open the Visit Dashboard from the colored square in the repository.
- Use 2 to open repository-level filters and menu actions.
- Use 3 to identify the patient row you want to review.
- Use 4 to open the query overview for the trial.
- Use 5 to spot attention markers such as enrollment or upload warnings.
 When this warning is displayed an error has occurred during data upload and as a result SliceVault is not able to display the uploaded data correctly.
Filter and Focus Your Review
Use the repository controls when you need to:
- focus on visits in a specific workflow state
- find patients that still require monitor or project manager action
- identify where forms, queries, or alerts are present
The repository menu and filters are especially useful in larger studies where many sites and visits are active at the same time.
Visit Status and Color Indicators
The colored squares in the study repository indicate the status of each visit:
White: No data uploaded to the visit.
Gray: Data has been uploaded, but the visit has not yet been submitted and is not accessible to you at this stage.
Light Green: Quality control review is finalized and visit is approved.
Dark green: Assessment completed by all Readers.
Red: Visit is rejected by either QC 1, QC 2 or Reader.
These color codes provide a quick visual summary of each visit’s status, helping you easily identify any missing data or actions required. The colored squares, the visits, can also be home to different icons, and these icons are visible when there is something in particular you should be aware of.
 The query sign is shown when a visit has an open query.
 The form sign is shown when you have not yet completed a mandatory Monitor or Project Manager form.
![]() The deadline alert sign is shown when the deadline has passed for completing your form (if required). Depending on the trial you will typically have a given number of days to complete your form (if required).
The deadline alert sign is shown when the deadline has passed for completing your form (if required). Depending on the trial you will typically have a given number of days to complete your form (if required).
Next Step
Once you have identified the visit you want to inspect, click the colored square to open the Visit Dashboard.
For the visit-level review flow, including forms, documents, downloads, and Preview Image, see Review Forms and Documents.