Study Repository
The repository is the main Investigator landing page. It shows your patients, the available visits, and which visits still need site action.
Each row represents a patient. Each visit column contains a colored square that shows the workflow state for that visit. Click the square to open the Visit Dashboard.
For a focused walkthrough of finding and opening the correct visit, see Open the Visit Dashboard.
Patient List
The patient list shows the patients and visits available to your site. The columns can vary by study, but the core layout stays the same.
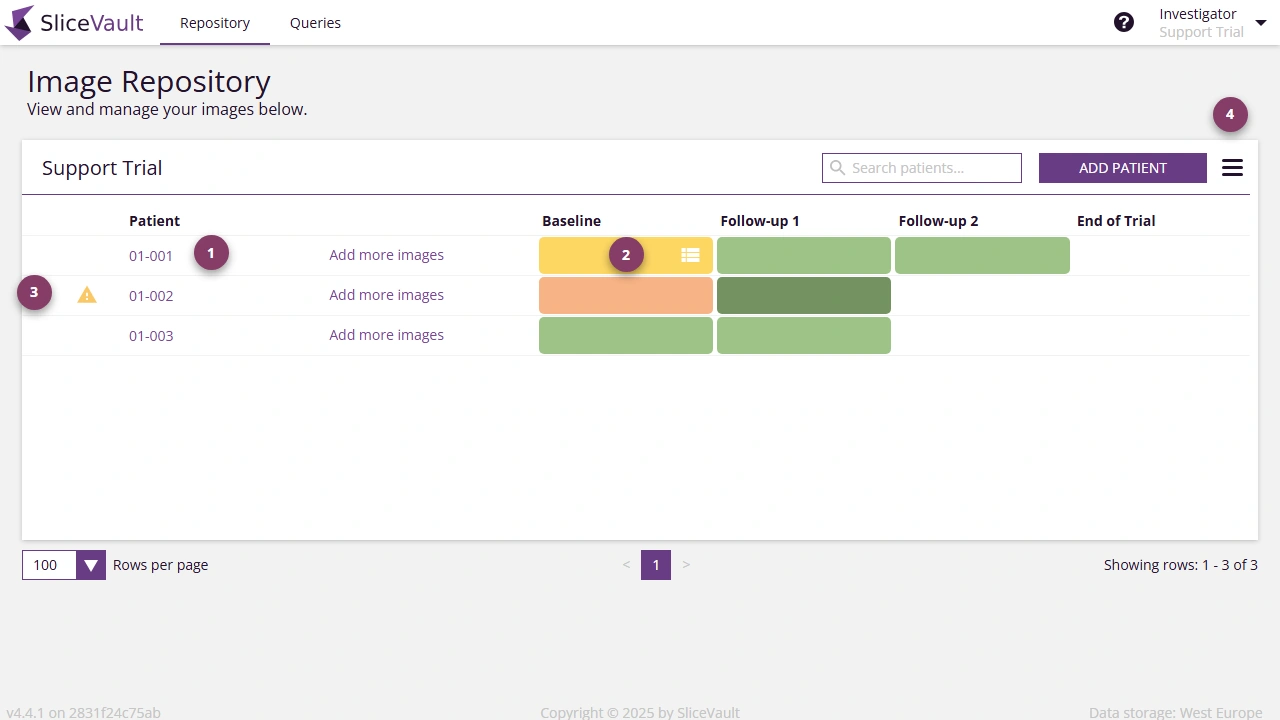
- Click the patient ID to update the patient record or enrollment status.
- Click the colored square to open the Visit Dashboard.
- Yellow and red warning markers show enrollment or upload issues that need follow-up.
- Use the menu to show or hide additional repository information.
Visit Status and Color Indicators
The colored squares in the study repository indicate the status of each visit:
-
White: no data uploaded to the visit
-
Yellow: data uploaded but still waiting for Investigator action
-
Light green: visit submitted by the Investigator
-
Dark green: visit approved in the later workflow steps
-
Red: visit rejected and sent back in the workflow
The square can also contain icons when extra attention is required.
-
 A query icon means the visit has an open query.
 -
 A checklist icon means a required form is still incomplete.
Next Step
Once you have identified the correct patient and visit in the repository, click the colored square to open the Visit Dashboard.
Continue with Open the Visit Dashboard, where the visit-level actions are explained in detail.